We’re always interested in finding out more about how people with migraine can access health care services, and what, where and when there are difficulties.
Last year, we put in an Official Information Act request to Te Whatu Ora/Health New Zealand, to see if we could find out how many people were seen by neurologists in public hospitals.
It turned out to be quite difficult to interpret the numbers we got back, and we had to go back to Te Whatu Ora several times in an attempt to clarify what these meant, but after much puzzling, we’ve decided to put them out, warts and all. The only way we’re going to get a better understanding about what the numbers mean is to make them public and start talking about them.
Our initial questions were:
- How many referrals from primary care (GPs) to outpatient neurology clinics in public hospitals are for headache or migraine?
We asked about both headache and migraine to pick up referrals which could be migraine, for example, people where the diagnosis of migraine was not clear.
- What proportion of all referrals from primary care to outpatient neurology clinics in public hospitals are for headache or migraine?
We wanted to know how much of the workload of neurology clinics could be taken up with headache and migraine queries.
Numbers of headache and migraine referrals to neurology services
We were told this information was not held at a national level and Te Whatu Ora would have to consult across all their local regions. Regions unable to provide the information, because this would have required manual review of files were Auckland, Lakes, West Coast and Waikato.
Other areas don’t have neurology services e.g. Whanganui, Taranaki, Tairāwhiti and South Canterbury, so were outside of the scope of the request. However, Wairarapa doesn’t have neurology services but they supplied information, so this was a puzzle – but since they reported <5 referrals, we haven’t included this. We were told Taranaki has visiting neurologists from Auckland.
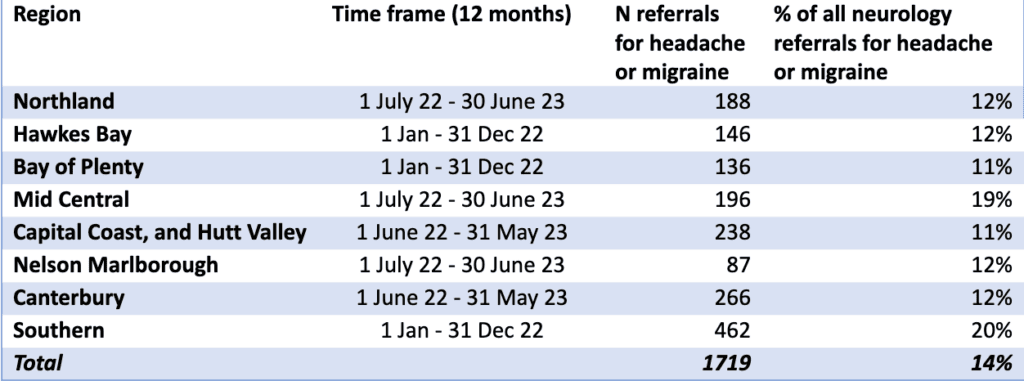
The information supplied was for 12 months, but over varying timeframes. From Table 1, we can see that the number of referrals was highest in Southern and the proportion of all neurology referrals that were for headache or migraine varied from 11–20%. The cause of this variation is not obvious. There’s no reason to think that people living in the Mid Central and Southern regions would have higher rates of headache than their neighbours or lower rates of other neurological symptoms and conditions. Perhaps neurology departments in these regions are seeing more patients with headache than in other areas, which might encourage GPs to make more referrals?

Outcome of headache and migraine referrals to neurology services
We sought to explore this with another question to Te Whatu Ora:
- What proportion of referrals for headache or migraine are accepted to be seen in neurology outpatient clinics and what proportion are rejected/sent back to the referrer?
We know that waiting times can influence decisions to make referrals so we also asked:
- For those referrals that are accepted, what is the average waiting time to be seen?
The response from Waikato was that “headaches associated with a single symptom (particularly the pain of the headache itself) do not necessitate a referral to neurology. In general, we would only consider accepting headache referrals with associated and concerning neurological symptoms. For this reason, Te Whatu Ora Waikato do not measure the number of patients referred to the Neurology Department at Waikato Hospital for a headache or migraine as the primary diagnosis.”
We might infer from this that Waikato declines all referrals to neurology for headache or migraine.
However, we did not appreciate the different ways that “accepted to be seen” and “rejected/sent back to the referrer” could be interpreted. What we should have asked, and subsequently did, was how many referrals ended up with an in-person appointment with a neurologist, how many referrals were outright declined, and how many referrals were returned to the GP with some form of advice about how the GP could manage the patient (but there was no actual consultation with the patient). We only got this level of detail from four regions and were struck by the lack of consistency in how these categories were reported.
Te Whatu Ora Bay of Plenty used categories of “Declined”; “Advice sent to Referrer”; “Accepted for Non-contact (virtual) First Specialist Assessment (FSA)”; “Accepted for FSA”. An FSA is an initial consultation with a specialist (a neurologist, in this case). Subsequent consults would be follow-up visits.
It’s worth noting that a “virtual” FSA does not mean the patient was seen virtually, it means that the referrer is sent a “written plan of care” and the patient is effectively “discharged” back to the GP. The written plan of care will be more substantial than “simple advice” although the distinction between these categories is not standard, as demonstrated by the response from Te Whatu Ora Nelson Marlborough. This region used categories of “Declined”; “In person Clinic Appointment/assessment”; “Given Simple Advice (Non-Contact)”.
Te Whatu Ora Northland used categories of “Declined” (with a subcategory of “Further Information Required”); “Simple Advice”; “Virtual FSA”; “Clinic Appointment/Assessment”. Only “Clinic Appointment/Assessment” and “Accepted for FSA” meant that the patient was actually seen by a neurologist.
Te Whatu Ora Waitaha Canterbury/Te Tai o Poutini West Coast initially provided numbers for “Declined” and “Accepted” but on additional questioning, broke down “Accepted” into categories including “Accepted-Seen-In Person”; “Accepted-Seen-Virtual-Advice”; “Accepted-Seen-Virtual-FSA” and “Accepted-Not Seen” (e.g. appointment booked or overdue). They noted that “Virtual-FSA” involves provision of a full written management plan and is more detailed than “Advice”, but does not imply “telehealth consultation” (e.g. a telephone or video consultation with the patient). We found it strange that referrals classified as “Accepted-Seen-Virtual” did not in fact involve any patient being “Seen”. Semantics, perhaps, but for many patients who are referred to neurology and do not get an in-person appointment, they do not feel seen or heard or cared for. They feel, often, rejected.
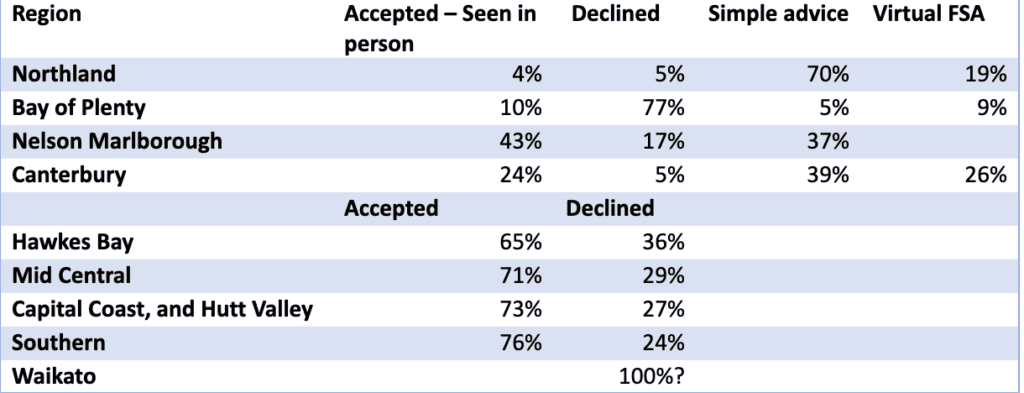
Other regions (Hawkes Bay, Mid Central, Capital Coast and Hutt Valley, Southern) were unable to provide the more nuanced breakdown of what “Accepted” meant in practice, but we can infer that many, or most, of these “Accepted” referrals would have resulted in simple advice or a management plan being returned to the GP and patient. Even without this detail, there was a huge range in the proportion of headache/migraine referrals that were declined (Table 2), from 5-77% (or potentially 100% if we consider Waikato’s response).
Among the four regions where we have more information, there was also a large variation in those who were accepted to be seen in person (4-43%). One reason for this difference could be the presence of a headache specialist in Nelson Marlborough (43% seen in person) and limited neurology services in Northland (4% seen in person).

Waiting times for headache and migraine referrals to neurology services
Another contributing factor to these differences could be waiting time (Table 3). For referrals accepted to be seen (which we are assuming means “Seen” in the literal sense, i.e. in person in a neurology clinic), average waiting times ranged from 35 days (Nelson Marlborough) to 119 days (Hawkes Bay). Northland did not provide an average but stated that “urgent patients are generally seen within one week, semi-urgent within six weeks, routine within four months.”

Conclusions
Although the information we’ve received about referrals to neurology from primary care is incomplete, we can make some conclusions.
Referrals for headache and migraine make up a considerable proportion of all neurology referrals – 14% on average, for the regions we have data on. There is large regional variation in the proportion of referrals that are declined, which creates inequities in access across the country – the postcode lottery that Te Whatu Ora was set up to get rid of. We do not know the underlying reasons for this variation, but we need to find out.
We also need to fill the gaps so we have complete information that’s monitored and reported on regularly. Te Whatu Ora needs to standardise reports across regions and make sure all regions have systems set up so reporting is routine and easy. How can Te Whatu Ora improve systems, equity and health outcomes when they don’t know what they are doing or why there are differences in service provision?


